Lifetime brain atrophy GWAS

Author

Anna Elisabeth Furtjes

Published

June 6, 2025

Doi

Here I display the analysis code to accompany our lifetime brain atrophy (LBA) genetics project. For consistency, the analysis steps outlined below match the order of presentation in the manuscript but does not necessarily reflect the order in which analyses were executed.

Pre-registration: https://osf.io/gydmw/

Analysis steps

Data preparation

  1. UK Biobank

    1.1. Phenotypic data

    1.2. Neuroimaging data

    1.3. Genetic data

  2. LBC1936

    2.1. Phenotypic data

    2.2. Neuroimaging data

  3. Human Connectome Project (HCP)

  4. Generation Scotland Subsample (STRADL)

  5. MRi-Share

Description and characterisation of the LBA phenotype

  1. Descriptive statistics (Table S6)

  2. Measures of LBA predict brain atrophy rated by neuroradiological experts, as well as other ageing-related health traits such as frailty and cognitive ability

  3. Measures of LBA indicate age-associated brain shrinkage

    2.1. Single time-point MRI measures age correlation

    2.2. Repeated MRI measures age correlations in LBC1936

  4. LBA moderately captures within-person atrophic changes that were longitudinally observed between two MRI scans a few years apart

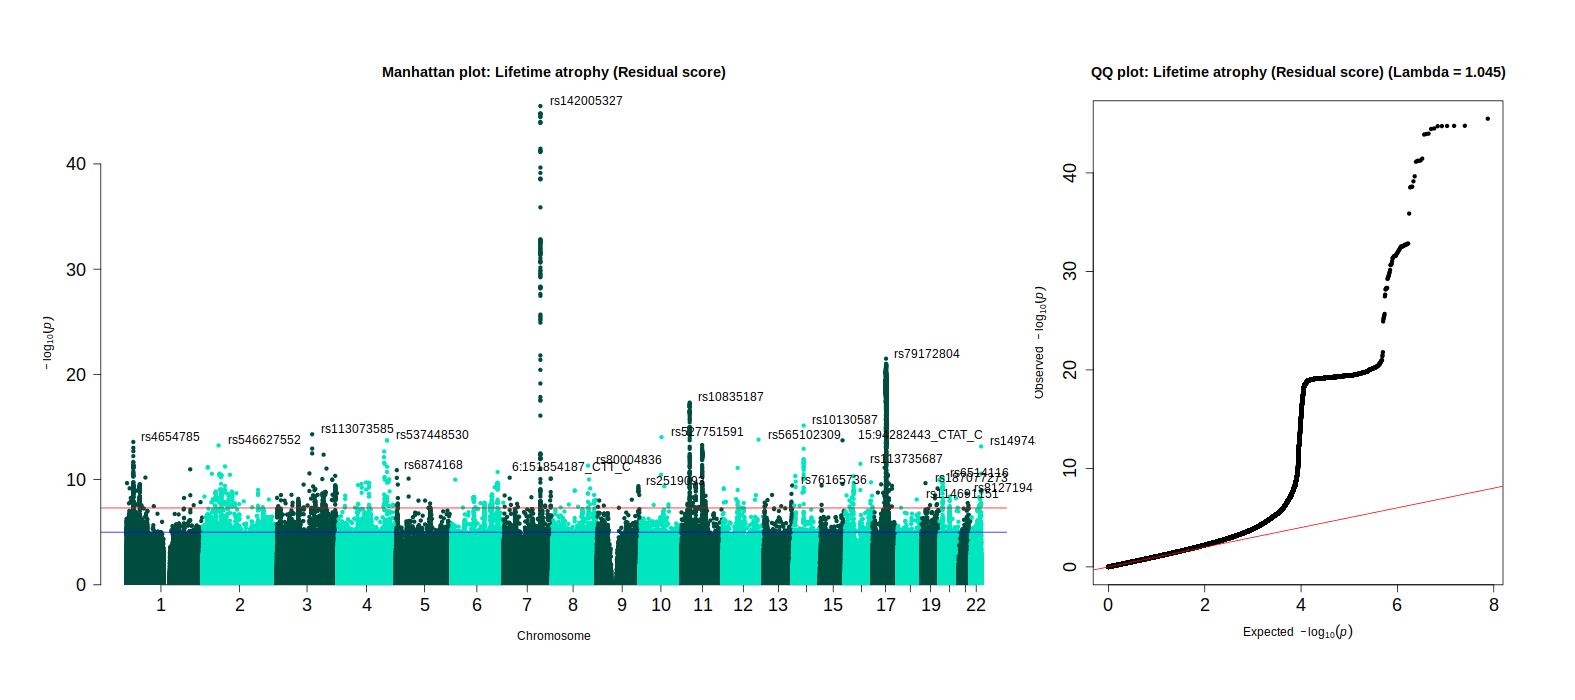
Genome-wide association study of LBA

  1. SNP-heritability

  2. GWAS analysis

  3. Genetic correlations

Supplementary analyses

  1. LBA from main analysis (FreeSurferv5) comparisons with manually segmented estimates of LBA and FreeSurfer v7

  2. Pre-registered aims 3.1-3.3

  3. Conservative z-test to compare h2 estimates

  4. Determining the most appropriate number of genetic PCs

  5. Comparison FUMA results across LBA phenotypes


GWAS Manhattan plot for LBA (residual score)