Analyses presented here are only included for completeness, and should be interpreted with caution due to issues of multicollinearity. Those analyses were conceived as part of the pre-registration and are included in the supplementary materials of the paper.
Create functions
Code
Aim3 =function(neuro = neuro,pheno = pheno,model1 ="Ig ~ CSF",model2 ="Ig ~ CSF + ICV",modelType =c("Linear", "Logistic", "hurdle"),na.action ="None",Cohort =NA,Aim =NA){# make sure only one model type was chosenif(length(modelType) !=1){warning("You must choose exactly 1 model type/ technique!"); break}# select appropriate time points#neuro = neuro[which(neuro$wave == neuroWave),]# edit 8/4/2023: the data has been separately saved from different waves so no need to subset# identify ID variable shared between data sets IDvar =names(neuro)[names(neuro) %in%names(pheno)]if(length(IDvar) ==0){warning("The two input files cannot be merged because they don't have a shared column name!"); break}# identify variable of interest name varName =gsub(" .*$", "",model1)# merge neuro and pheno dat =as.data.frame(merge(neuro, pheno, by = IDvar))############## remove NAs from any of the modelled variables because model 1 and model 2 may otherwise not be fitted to the same size dataset# identify the longer model# note: nchar should be enough of a criterion to identify the longer model because model1 and model2 are nested and should include the same variables with the same number of characters with the exception of one additional predictorif(na.action =="na.rm"){ index=which(c(nchar(model1), nchar(model2)) ==max(c(nchar(model1), nchar(model2)))) longest =get(paste0("model", index))# identify variables indicates in longest model vars=strsplit(longest, " ")[[1]]# keep every second character because this will exclude the special model characters Seq =seq(1, 100, by =2) vars = vars[Seq] vars = vars[!is.na(vars)]# only keep variables indicated in the model dat = dat[,c(IDvar, vars)]# remove missing data dat =na.omit(dat) }############# throw error if varName doe snot exist in dataif(isFALSE(varName %in%names(dat))){warning("The model you indicated includes a variable that does not exist in the data.") }# create object to hold final results results =list()# create objects to hold temporary results mNames =c("AIC", "BIC", "R2_percent", "N") m1 =data.frame(matrix(nrow =1, ncol =length(mNames)))names(m1) = mNames m2 =data.frame(matrix(nrow =1, ncol =length(mNames)))names(m2) = mNamesif(modelType =="Linear"){# define model 1 fit1 =lm(model1, data = dat)# define model 2 fit2 =lm(model2, data = dat)# R2 (not adjusted R2) m1$R2_percent =summary(fit1)$r.squared *100 m2$R2_percent =summary(fit2)$r.squared *100# compare model fit results[["LRT"]] =anova(fit1, fit2, test ="Chisq") }elseif(modelType =="Logistic"){# dependent variable in logistic model must be a factor dat[,varName] =as.factor(dat[,varName])# model 1 fit1 =glm(model1, family ="binomial", data = dat)# model 2 fit2 =glm(model2, family ="binomial", data = dat)# Adjusted R2#Nagelkerke N (1991) A note on a general definition of the coefficient of determination. Biometrika, 78: 691-692.#Faraway JJ (2006) Extending the linear models with R: Generalized linear, mixed effects and nonparametric regression models. Chapman and Hall. m1$R2_percent = fmsb::NagelkerkeR2(fit1)$R2 *100 m2$R2_percent = fmsb::NagelkerkeR2(fit2)$R2 *100# compare model fit results[["LRT"]] =anova(fit1, fit2, test ="Chisq")# store chi2p value in m1#m1$chi2p }elseif(modelType =="Hurdle"){# Due to the zero-inflated and data dispersed nature of variable such as packyears, previous studies have used hurdle negative binomial regression#https://www.ncbi.nlm.nih.gov/pmc/articles/PMC7235023/#https://github.com/CNPsyLab/UKB-Smoking/blob/master/UKB%20smoking%20gray%20matter%20analyses#https://www.rdocumentation.org/packages/pscl/versions/1.5.5.1/topics/hurdle# When a variable is overdispersed, SEs tend to be downward biased, making confidence intervalls smaller which could result in false conclusions# this function doesn't run unless packyears is an integer & predictor variables have been standardised (especially TBV and ICV that have large total values)# Understanding Hurdle regression:# Suppose that g1(0) is the probability value when the value for response variable iszero and that g2(k), k = 1, 2, . . . is a probability function when the response variable is apositive integer# Two parts of the equation:q# 1. get marginal effects: logit(y ~ x1 + x2)# 2. get marginal effects (for y > 0): ztnb(y ~ x1 + x2) [zero-truncated negative binomial]# dependent variable has to be integer dat[,varName] =as.integer(round(dat[,varName]))# define first model fit1 = pscl::hurdle(as.formula(model1), data = dat, dist="negbin")# define second model fit2 = pscl::hurdle(as.formula(model2), data = dat, dist="negbin")# calculate pseudo R2 (picked r2ML)# rough analogue to the computation of r-squared in a linear regression m1$R2_percent = pscl::pR2(fit1)[5]*100 m2$R2_percent = pscl::pR2(fit2)[5]*100# model comparison using log-likelihood x_1=-(fit1$loglik) x_2=-(fit2$loglik)# The likelihood ratio test is based on the statistic lambda = -2*(x_1-x_2). If the null model is correct, this test statistic is distributed as chi-squared with degrees of freedom, k, equal to the difference in the number of parameters between the two models that are being fit for. This is known as Wilk’s theorem. lambda =-2*(x_1 - x_2)# k can be calculated by subtracting the total number of parameters in the smaller model from the total parameters in the larger model# identify number of variables in model 1 vars1=strsplit(model1, " ")[[1]] Seq =seq(1, 100, by =2) vars1 = vars1[Seq] L1 =length(vars1[!is.na(vars1)])# identify number of variables in model 2 vars2=strsplit(model2, " ")[[1]] Seq =seq(1, 100, by =2) vars2 = vars2[Seq] L2 =length(vars2[!is.na(vars2)])# calculate k k =abs(L1-L2)if(k !=0){# calculate LRT p-value chi2p=1-pchisq(lambda,k) }elseif(k ==0){ chi2p =NAmessage("You indicated two models that are not nested. Hence, LRT cannot be calculated, k = 0 and p-value is noted NA in the results table.") }# save LRT results an =data.frame(model1 = model1,model2 = model2,lambda = lambda,k = k,chi2p = chi2p) results[["LRT"]] = an }# AIC m1$AIC = stats::extractAIC(fit1)[2] m2$AIC = stats::extractAIC(fit2)[2]# BIC m1$BIC = stats::BIC(fit1) m2$BIC = stats::BIC(fit2)# N m1$N =sum(!is.na(dat[,varName])) m2$N =sum(!is.na(dat[,varName]))# store pheno info m1$Phenotype = varName m2$Phenotype = varName# store more general model info m1$Model = stringr::str_replace(model1, pattern = varName, replacement ="Phenotype") m2$Model = stringr::str_replace(model2, pattern = varName, replacement ="Phenotype")# store atrophy score m1$AtrophyScore =NAif(length(grep("diff", model1)) !=0){ m1$AtrophyScore ="Difference score" }elseif(length(grep("ratio", model1)) !=0){ m1$AtrophyScore ="Ratio score" }elseif(length(grep("resid", model1)) !=0){ m1$AtrophyScore ="Residual Score" } m2$AtrophyScore =NAif(length(grep("diff", model1)) !=0){ m2$AtrophyScore ="Difference score" }elseif(length(grep("ratio", model1)) !=0){ m2$AtrophyScore ="Ratio score" }elseif(length(grep("resid", model1)) !=0){ m2$AtrophyScore ="Residual Score" }# Cohort if not emptyif(!is.na(Cohort)){ m1$Cohort = Cohort m2$Cohort = Cohort }# Aim if not emptyif(!is.na(Aim)){ m1$Aim = Aim m2$Aim = Aim }# save frames in final results results[["m1"]] = m1 results[["m2"]] = m2return(results)}#### visualise Aim 3### define functions# visualise aim 3.1plot_aim3.1=function(res = res,modelX = modelX,modelY = modelY,chi2sigThreshold =0.5/13){# load libslibrary(ggplot2)library(ggrepel)# add superscript superscript =quote(R^2)# create chi-square category res$`Model comparison:\nChi-squared p-value`="No nested model" res$`Model comparison:\nChi-squared p-value`[!is.na(res$sig)] =paste0("ns. (p > ",round(chi2sigThreshold, digits =3),")") res$`Model comparison:\nChi-squared p-value`[which(res$sig < chi2sigThreshold)] =paste0("sig. (p < ",round(chi2sigThreshold, digits =3),")")# clean label column to keep sigTraits only res$Phenotype[which(res$sig > chi2sigThreshold)] =NA# also remove label if ns and R2 below 1% res$Phenotype[res$R2_percent_m1 <1.5& res$R2_percent_m2 <1.5] =NAggplot(data = res) +geom_jitter(aes(x = R2_percent_m1, y = R2_percent_m2, colour = AtrophyScore, shape =`Model comparison:\nChi-squared p-value`),size =3,alpha =0.5,position ="jitter")+xlab(bquote(.(modelX) ~ R^2))+ylab(bquote(.(modelY) ~ R^2))+geom_abline(slope =1, intercept =0, colour ="grey")+ylim(-0.5,9.5)+xlim(-0.5,14.5)+#geom_segment(aes(x = 9, y = 8.2, xend = 9, yend = 8.7),# lineend = "round", linejoin = "round", color = "grey", linewidth = 0.5,# arrow = arrow(length = unit(0.2, "cm"), type = "open"))+annotate(x =9, y =7.5, geom ="text", label ="Line of identity\n(intercept = 0,\nslope = 1)", colour ="grey")+geom_text_repel(aes(x = R2_percent_m1, y = R2_percent_m2, label = Phenotype, color = AtrophyScore),box.padding =0.5, max.overlaps =Inf,direction ="y")+theme_bw()+theme(axis.text.x =element_text(size=10, colour='#696969'), #text = element_text(size=10),axis.text.y =element_text(size=10, colour='#696969'),plot.title =element_text(face="bold", colour='#1A1A1A', size=10, hjust =0.5),axis.title.x =element_text(face="bold", colour='#1A1A1A', size=10, vjust =-0.5),axis.title.y =element_text(face="bold", colour='#1A1A1A', size=10),axis.line.x.bottom =element_line(colour ="grey"),axis.line.x.top =element_blank(),axis.line.y.left =element_line(colour ="grey"),axis.line.y.right =element_blank(),axis.ticks.x =element_blank(),axis.ticks.y =element_blank(),panel.border =element_blank(),axis.title.x.top =element_text(color ="grey", size=10, hjust=0),plot.margin =margin(1.1,1.1,1.1,1.1, "cm"))}# visualise aim 3.2plot_aim3.2=function(res = res,modelX = modelX,modelY = modelY,chi2sigThreshold =0.5/13){# identify sig taits according to chi2p res$`Model comparison:\nChi-squared p-value`=paste0("ns. (p > ",round(chi2sigThreshold, digits =3),")") res$`Model comparison:\nChi-squared p-value`[which(res$sig < chi2sigThreshold)] =paste0("sig. (p < ",round(chi2sigThreshold, digits =3),")")# clean label column to keep sigTraits only sigTraits = res$Phenotype[which(res$sig < chi2sigThreshold)] res$Phenotype[!res$Phenotype %in%sigTraits] =NA res$Phenotype[duplicated(res$Phenotype)] =NA superscript =quote(R^2)# load libslibrary(ggplot2)library(ggrepel)ggplot(data = res) +geom_jitter(aes(x = R2_percent_m1, y = R2_percent_m2, colour = AtrophyScore, shape =`Model comparison:\nChi-squared p-value`),size =3,alpha =0.5,position ="jitter")+xlab(bquote(.(modelX) ~ R^2))+ylab(bquote(.(modelY) ~ R^2))+geom_abline(slope =1, intercept =0, colour ="grey")+ylim(-0.5,10)+xlim(-0.5,15)+annotate(x =2, y =4, geom ="text", label ="Line of identity\n(intercept = 0,\nslope = 1)", colour ="grey")+#(atan(2)*180/pi)-1.434949)geom_text_repel(aes(x = R2_percent_m1, y = R2_percent_m2, label = Phenotype),segment.color ="grey45",color ="grey45",box.padding =0.5, max.overlaps =Inf,direction ="y")+theme_bw()+theme(text =element_text(size=10),axis.text.x =element_text(size=10, colour='#696969'),axis.text.y =element_text(size=10, colour='#696969'),plot.title =element_text(face="bold", colour='#1A1A1A', size=10, hjust =0.5),axis.title.x =element_text(face="bold", colour='#1A1A1A', size=10),axis.title.y =element_text(face="bold", colour='#1A1A1A', size=10),axis.line.x.bottom =element_line(colour ="grey"),axis.line.x.top =element_blank(),axis.line.y.left =element_line(colour ="grey"),axis.line.y.right =element_blank(),axis.ticks.x =element_blank(),axis.ticks.y =element_blank(),panel.border =element_blank(),axis.title.x.top =element_text(color ="grey", size=10, hjust=0))}# visualise aim 3.3plot_aim3.3=function(res = res,modelX = modelX,modelY = modelY,chi2sigThreshold = chi2sigThreshold){# identify sig taits according to chi2p res$`Model comparison:\nChi-squared p-value`=paste0("ns. (p > ",round(chi2sigThreshold, digits =3),")") res$`Model comparison:\nChi-squared p-value`[which(res$sig < chi2sigThreshold)] =paste0("sig. (p < ",round(chi2sigThreshold, digits =3),")")# clean label column to keep sigTraits only res$Phenotype[which(res$sig > chi2sigThreshold)] =NA superscript =quote(R^2)# load libslibrary(ggplot2)library(ggrepel)ggplot(data = res) +geom_jitter(aes(x = R2_percent_m1, y = R2_percent_m2, colour = AtrophyScore, shape =`Model comparison:\nChi-squared p-value`),size =3,alpha =0.5,position ="jitter")+xlab(bquote(.(modelX) ~ R^2))+ylab(bquote(.(modelY) ~ R^2))+geom_abline(slope =1, intercept =0, colour ="grey")+ylim(-0.5,14.5)+xlim(-0.5,23)+annotate(x =2, y =4, geom ="text", label ="Line of identity\n(intercept = 0,\nslope = 1)", colour ="grey")+geom_text_repel(aes(x = R2_percent_m1, y = R2_percent_m2, label = Phenotype, color = AtrophyScore),segment.color ="grey",box.padding =0.5, max.overlaps =Inf,direction ="y")+theme_bw()+theme(text =element_text(size=10),axis.text.x =element_text(size=10, colour='#696969'),axis.text.y =element_text(size=10, colour='#696969'),plot.title =element_text(face="bold", colour='#1A1A1A', size=10, hjust =0.5),axis.title.x =element_text(face="bold", colour='#1A1A1A', size=10),axis.title.y =element_text(face="bold", colour='#1A1A1A', size=10),axis.line.x.bottom =element_line(colour ="grey"),axis.line.x.top =element_blank(),axis.line.y.left =element_line(colour ="grey"),axis.line.y.right =element_blank(),axis.ticks.x =element_blank(),axis.ticks.y =element_blank(),panel.border =element_blank(),axis.title.x.top =element_text(color ="grey", size=10, hjust=0))}
Lothian Birth Cohort 1936 (LBC1936)
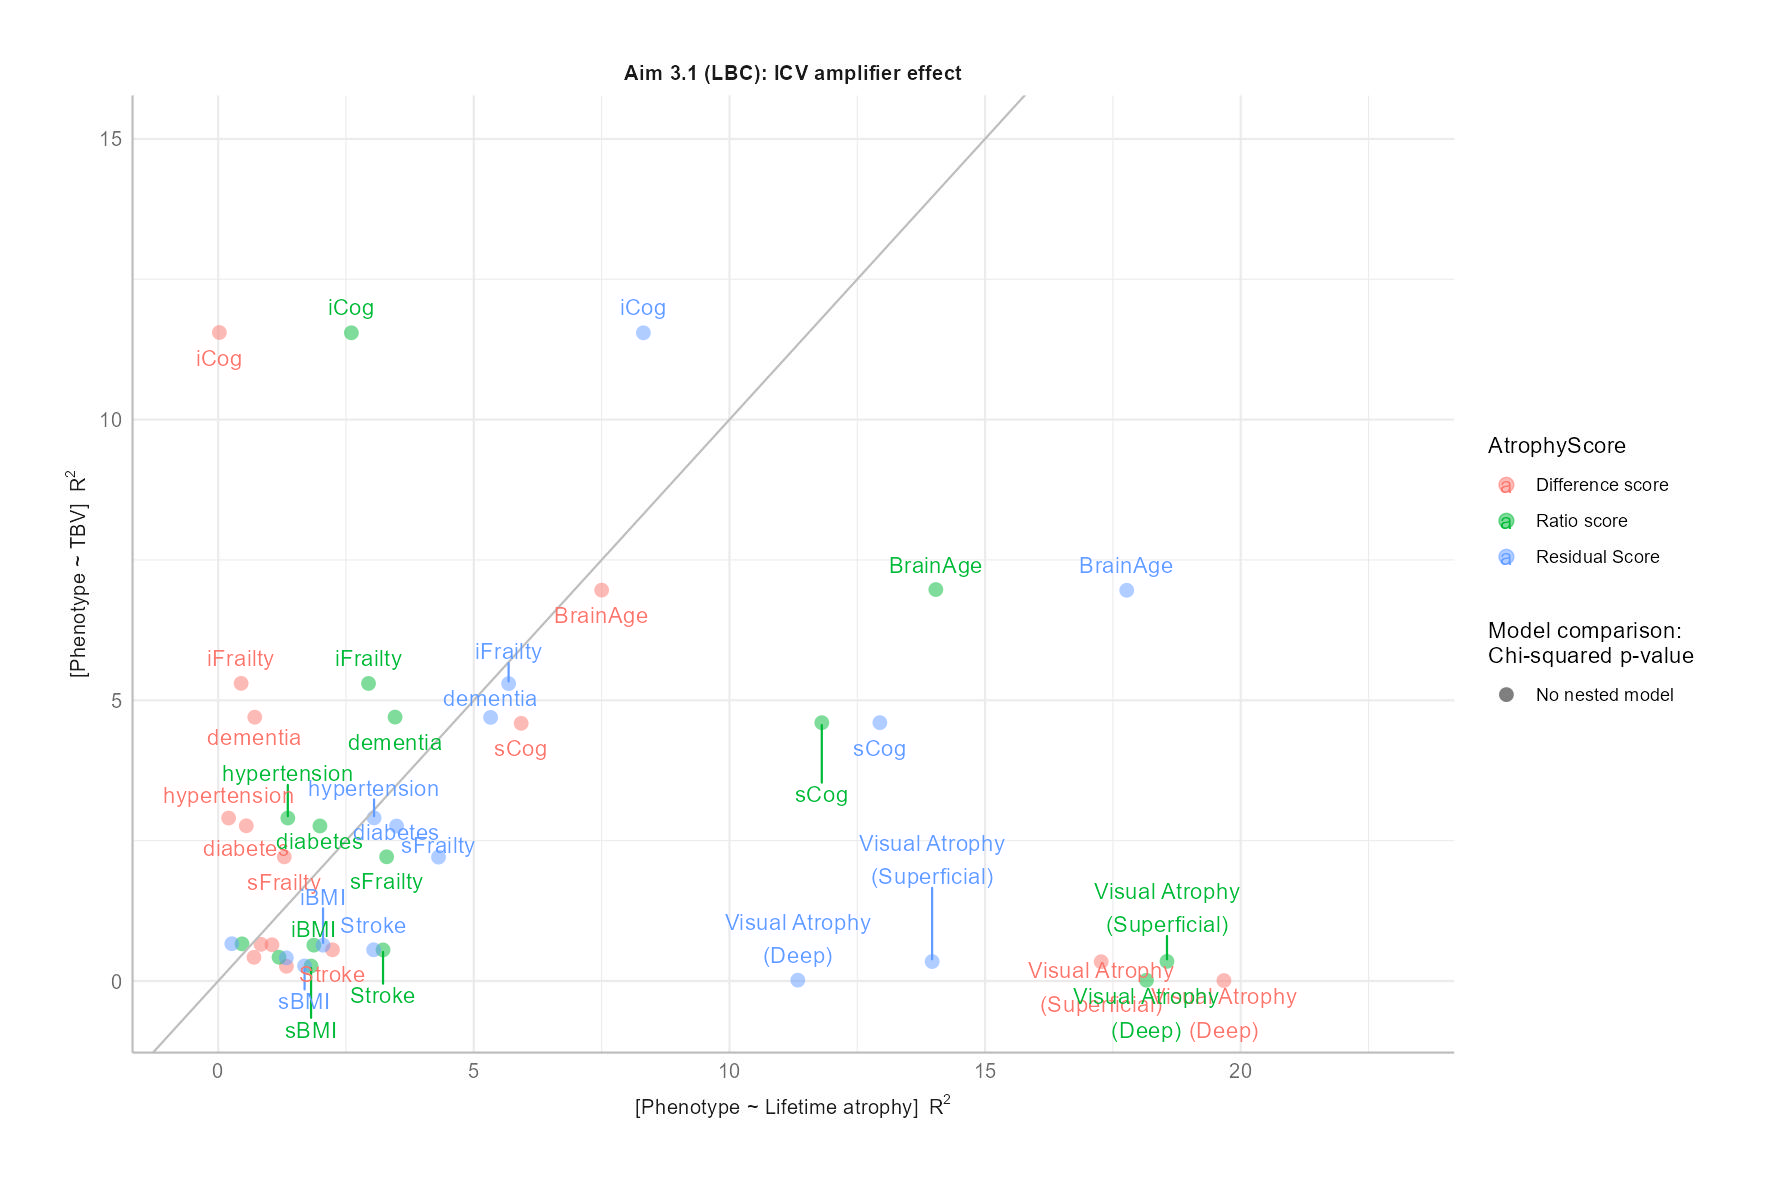
Aim 3.1
We hypothesise that evidence from Section 3.1 will confirm that health outcome prediction in older-age populations can be amplified when models consider ICV as a covariate alongside TBV, as this should focus the analysis on brain matter losses rather than differences in head size.
Difference score
Health-related phenotypes ~ ICV time 2 - TBV time 2
Health-related phenotypes ~ TBV time 2
Note that by time 2 I am mean the second visit we’re considering, i.e., wave 5 in LBC.
Code
# read in LBC data neuro =fread(paste0(wd, "/LBC1936_crossNeuroWave4.txt"), data.table = F)pheno =fread(paste0(wd, "/LBC1936_allPheno.txt"), data.table = F)# standardise numeric variables ColNames =c("iCog", "sCog", "iFrailty", "sFrailty", "iBMI", "sBMI", "BrainAge")pheno[,ColNames] =as.data.frame(lapply(pheno[,ColNames], scale))# iterate through all LBC traitsfor(i innames(pheno)[which(names(pheno) !="lbc36no")]){# define models model1 =paste0(i, " ~ diff_stand") model2 =paste0(i, " ~ TBVstand")if(i %in%c("iCog", "sCog", "iFrailty", "sFrailty", "iBMI", "sBMI", "BrainAge")){ modelType ="Linear" }elseif(i %in%c("dementia", "APOEe4", "diabetes", "hypertension", "stroke")){ modelType ="Logistic" }elseif(i %in%"packyears"){ modelType ="Hurdle" }# run Aim3 function res =Aim3(neuro = neuro, pheno = pheno,model1 = model1,model2 = model2,modelType = modelType, Cohort ="LBC", Aim ="3.1")# name it according to its testassign(paste0("LBC_3.1_diff_", i), res)}ls(pattern ="LBC_3.1_diff")
Ratio score
Health-related phenotypes ~ TBV time 2 / ICV time 2
Health-related phenotypes ~ TBV time 2
Code
# iterate through all LBC traitsfor(i innames(pheno)[which(names(pheno) !="lbc36no")]){# define models model1 =paste0(i, " ~ ratio_stand") model2 =paste0(i, " ~ TBVstand")if(i %in%c("iCog", "sCog", "iFrailty", "sFrailty", "iBMI", "sBMI", "BrainAge")){ modelType ="Linear" }elseif(i %in%c("dementia", "APOEe4", "diabetes", "hypertension", "stroke")){ modelType ="Logistic" }elseif(i %in%"packyears"){ modelType ="Hurdle" }# run Aim3 function res =Aim3(neuro = neuro,pheno = pheno,model1 = model1,model2 = model2,modelType = modelType, Cohort ="LBC", Aim ="3.1")# name it according to its testassign(paste0("LBC_3.1_ratio_", i), res)}ls(pattern ="LBC_3.1_ratio")
Residual score
Health-related phenotypes ~ TBV time 2 + ICV time 2
Health-related phenotypes ~ TBV time 2
Code
# iterate through all LBC traitsfor(i innames(pheno)[which(names(pheno) !="lbc36no")]){# define models model1 =paste0(i, " ~ resid_stand") model2 =paste0(i, " ~ TBVstand")if(i %in%c("iCog", "sCog", "iFrailty", "sFrailty", "iBMI", "sBMI", "BrainAge")){ modelType ="Linear" }elseif(i %in%c("dementia", "APOEe4", "diabetes", "hypertension", "stroke")){ modelType ="Logistic" }elseif(i %in%"packyears"){ modelType ="Hurdle" }# run Aim3 function res =Aim3(neuro = neuro,pheno = pheno,model1 = model1,model2 = model2,modelType = modelType, Cohort ="LBC", Aim ="3.1")# name it according to its testassign(paste0("LBC_3.1_resid_", i), res)}ls(pattern ="LBC_3.1_resid")
CSF
Health-related phenotypes ~ CSF time 2 + ICV time 2
Health-related phenotypes ~ CSF time 2
Code
# iterate through all LBC traitsfor(i innames(pheno)[which(names(pheno) !="lbc36no")]){# define models model1 =paste0(i, " ~ CSFstand + ICVstand") model2 =paste0(i, " ~ CSFstand")if(i %in%c("iCog", "sCog", "iFrailty", "sFrailty", "iBMI", "sBMI", "BrainAge")){ modelType ="Linear" }elseif(i %in%c("dementia", "APOEe4", "diabetes", "hypertension", "stroke")){ modelType ="Logistic" }elseif(i %in%"packyears"){ modelType ="Hurdle" }# run Aim3 function res =Aim3(neuro = neuro, pheno = pheno,model1 = model1,model2 = model2,modelType = modelType, Cohort ="LBC", Aim ="3.1")# name it according to its testassign(paste0("LBC_3.1_CSF_", i), res)}ls(pattern ="LBC_3.1_CSF")
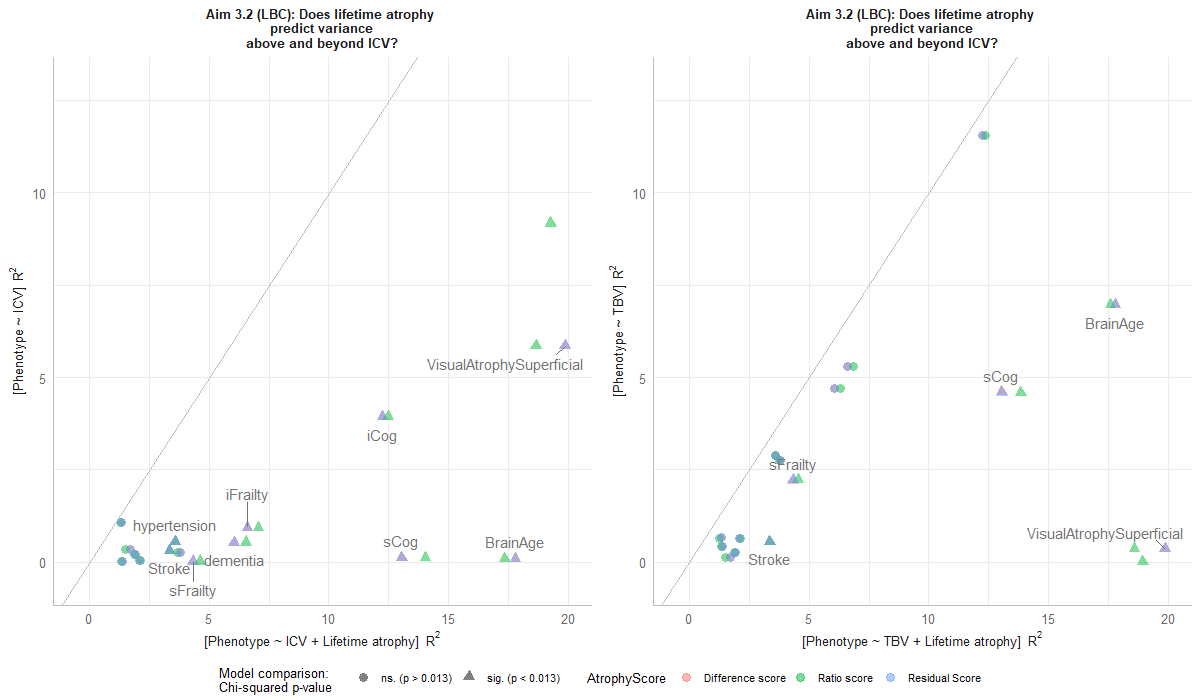
Aim 3.2
Health-related phenotypes ~ ICV time 2 (or TBV time 2) + cross-sectional atrophy time 2
Health-related phenotypes ~ ICV time 2 (or TBV time 2)
Note: repeat this analysis twice for models with TBV and models with TCV and for each cross-sectional atrophy measure (diff, resid, ratio)
As in aim 3.1, this is still using cross-sectional data from visit 2 (wave 5)
Difference score
Code
##### Model 1: comparison against ICV# iterate through all LBC traitsfor(i innames(pheno)[which(names(pheno) !="lbc36no")]){# define models model1 =paste0(i, " ~ ICVstand + diff_stand") model2 =paste0(i, " ~ ICVstand")if(i %in%c("iCog", "sCog", "iFrailty", "sFrailty", "iBMI", "sBMI", "BrainAge")){ modelType ="Linear" }elseif(i %in%c("dementia", "APOEe4", "diabetes", "hypertension", "stroke")){ modelType ="Logistic" }elseif(i %in%"packyears"){ modelType ="Hurdle" }# run Aim3 function res =Aim3(neuro = neuro, pheno = pheno,model1 = model1,model2 = model2,modelType = modelType, Cohort ="LBC", Aim ="3.2")# name it according to its testassign(paste0("LBC_3.2_diffvsICV_", i), res)}##### Model 2: comparison against TBV# iterate through all LBC traitsfor(i innames(pheno)[which(names(pheno) !="lbc36no")]){# define models model1 =paste0(i, " ~ TBVstand + diff_stand") model2 =paste0(i, " ~ TBVstand")if(i %in%c("iCog", "sCog", "iFrailty", "sFrailty", "iBMI", "sBMI", "BrainAge")){ modelType ="Linear" }elseif(i %in%c("dementia", "APOEe4", "diabetes", "hypertension", "stroke")){ modelType ="Logistic" }elseif(i %in%"packyears"){ modelType ="Hurdle" }# run Aim3 function res =Aim3(neuro = neuro, pheno = pheno,model1 = model1,model2 = model2,modelType = modelType, Cohort ="LBC", Aim ="3.2")# name it according to its testassign(paste0("LBC_3.2_diffvsTBV_", i), res)}ls(pattern="LBC_3.2_diff")
Ratio score
Code
##### Model 1: comparison against ICV# iterate through all LBC traitsfor(i innames(pheno)[which(names(pheno) !="lbc36no")]){# define models model1 =paste0(i, " ~ ICVstand + ratio_stand") model2 =paste0(i, " ~ ICVstand")if(i %in%c("iCog", "sCog", "iFrailty", "sFrailty", "iBMI", "sBMI", "BrainAge")){ modelType ="Linear" }elseif(i %in%c("dementia", "APOEe4", "diabetes", "hypertension", "stroke")){ modelType ="Logistic" }elseif(i %in%"packyears"){ modelType ="Hurdle" }# run Aim3 function res =Aim3(neuro = neuro, pheno = pheno,model1 = model1,model2 = model2,modelType = modelType, Cohort ="LBC", Aim ="3.2")# name it according to its testassign(paste0("LBC_3.2_ratiovsICV_", i), res)}##### Model 2: comparison against TBV# iterate through all LBC traitsfor(i innames(pheno)[which(names(pheno) !="lbc36no")]){# define models model1 =paste0(i, " ~ TBVstand + ratio_stand") model2 =paste0(i, " ~ TBVstand")if(i %in%c("iCog", "sCog", "iFrailty", "sFrailty", "iBMI", "sBMI", "BrainAge")){ modelType ="Linear" }elseif(i %in%c("dementia", "APOEe4", "diabetes", "hypertension", "stroke")){ modelType ="Logistic" }elseif(i %in%"packyears"){ modelType ="Hurdle" }# run Aim3 function res =Aim3(neuro = neuro, pheno = pheno,model1 = model1,model2 = model2,modelType = modelType, Cohort ="LBC", Aim ="3.2")# name it according to its testassign(paste0("LBC_3.2_ratiovsTBV_", i), res)}ls(pattern="LBC_3.2_ratio")
Residual score
Code
##### Model 1: comparison against ICV# iterate through all LBC traitsfor(i innames(pheno)[which(names(pheno) !="lbc36no")]){# define models model1 =paste0(i, " ~ ICVstand + resid_stand") model2 =paste0(i, " ~ ICVstand")if(i %in%c("iCog", "sCog", "iFrailty", "sFrailty", "iBMI", "sBMI", "BrainAge")){ modelType ="Linear" }elseif(i %in%c("dementia", "APOEe4", "diabetes", "hypertension", "stroke")){ modelType ="Logistic" }elseif(i %in%"packyears"){ modelType ="Hurdle" }# run Aim3 function res =Aim3(neuro = neuro, pheno = pheno,model1 = model1,model2 = model2,modelType = modelType, Cohort ="LBC", Aim ="3.2")# name it according to its testassign(paste0("LBC_3.2_residvsICV_", i), res)}##### Model 2: comparison against TBV# iterate through all LBC traitsfor(i innames(pheno)[which(names(pheno) !="lbc36no")]){# define models model1 =paste0(i, " ~ TBVstand + resid_stand") model2 =paste0(i, " ~ TBVstand")if(i %in%c("iCog", "sCog", "iFrailty", "sFrailty", "iBMI", "sBMI", "BrainAge")){ modelType ="Linear" }elseif(i %in%c("dementia", "APOEe4", "diabetes", "hypertension", "stroke")){ modelType ="Logistic" }elseif(i %in%"packyears"){ modelType ="Hurdle" }# run Aim3 function res =Aim3(neuro = neuro, pheno = pheno,model1 = model1,model2 = model2,modelType = modelType, Cohort ="LBC", Aim ="3.2")# name it according to its testassign(paste0("LBC_3.2_residvsTBV_", i), res)}ls(pattern="LBC_3.2_resid")
Aim 3.3
Health-related phenotypes ~ cross-sectional atrophy time 2 + longitudinal atrophy
Health-related phenotypes ~ cross-sectional atrophy time 2
Difference score
Code
# read in cross-sectional datacross =fread(paste0(wd,"/LBC1936_crossNeuroWave1.txt"), data.table = F)# read in longitudinal data long =fread(paste0(wd, "/LBC1936_longTBVWaves2and5.txt"), data.table = F)# merge cross and long data neuro =merge(cross, long, by ="lbc36no")# iterate through all LBC traitsfor(i innames(pheno)[which(names(pheno) !="lbc36no")]){# define models model1 =paste0(i, " ~ diff_stand + TBVdiff_2to5_stand") model2 =paste0(i, " ~ diff_stand")if(i %in%c("iCog", "sCog", "iFrailty", "sFrailty", "iBMI", "sBMI", "BrainAge")){ modelType ="Linear" }elseif(i %in%c("dementia", "APOEe4", "diabetes", "hypertension", "stroke")){ modelType ="Logistic" }elseif(i %in%"packyears"){ modelType ="Hurdle" }# run Aim3 function res =Aim3(neuro = neuro,pheno = pheno,model1 = model1,model2 = model2,modelType = modelType, na.action ="na.rm",Cohort ="LBC", Aim ="3.3")# name it according to its testassign(paste0("LBC_3.3_diff_", i), res)}ls(pattern="LBC_3.3_diff")
Ratio score
Code
# iterate through all LBC traitsfor(i innames(pheno)[which(names(pheno) !="lbc36no")]){# define models model1 =paste0(i, " ~ ratio_stand + TBVratio_5to2_stand") model2 =paste0(i, " ~ ratio_stand")if(i %in%c("iCog", "sCog", "iFrailty", "sFrailty", "iBMI", "sBMI", "BrainAge")){ modelType ="Linear" }elseif(i %in%c("dementia", "APOEe4", "diabetes", "hypertension", "stroke")){ modelType ="Logistic" }elseif(i %in%"packyears"){ modelType ="Hurdle" }# run Aim3 function res =Aim3(neuro = neuro, pheno = pheno,model1 = model1,model2 = model2,modelType = modelType, na.action ="na.rm",Cohort ="LBC", Aim ="3.3")# name it according to its testassign(paste0("LBC_3.3_ratio_", i), res)}ls(pattern="LBC_3.3_ratio")
Residual score
Code
# iterate through all LBC traitsfor(i innames(pheno)[which(names(pheno) !="lbc36no")]){# define models model1 =paste0(i, " ~ resid_stand + TBVresid_2to5_stand") model2 =paste0(i, " ~ resid_stand")if(i %in%c("iCog", "sCog", "iFrailty", "sFrailty", "iBMI", "sBMI", "BrainAge")){ modelType ="Linear" }elseif(i %in%c("dementia", "APOEe4", "diabetes", "hypertension", "stroke")){ modelType ="Logistic" }elseif(i %in%"packyears"){ modelType ="Hurdle" }# run Aim3 function res =Aim3(neuro = neuro, pheno = pheno,model1 = model1,model2 = model2,modelType = modelType, na.action ="na.rm",Cohort ="LBC", Aim ="3.3")# name it according to its testassign(paste0("LBC_3.3_resid_", i), res)}ls(pattern="LBC_3.3_resid")# save all models save(list=ls(pattern="LBC_"), file =paste0(wd, "/LBC_Aim3.4.RData"))
Aim 3.4
Code
########################################### sort through resultsload(paste0(wd, "/LBC_Aim3.4.RData"))ls(pattern="LBC_")# create two objects to hold results from model 1 and model 2m1 =data.frame()m2 =data.frame()# pull together all R2 values from all analyses in 3.1for(i inls(pattern ="LBC_")){# get object obj =get(i)# if CSF, no atrophy score has been recordedif(length(grep("CSF", i)) !=0){ obj$m1$AtrophyScore ="CSF" obj$m2$AtrophyScore ="CSF" }# save model to match m1 and m2 obj$m1$comp = i obj$m2$comp = i# save object results in m1 m1 =rbind(m1, obj$m1)# save object results in m2 m2 =rbind(m2, obj$m2)}# save whether m1 or m2names(m1)[which(names(m1) =="R2_percent")] ="R2_percent_m1"names(m1)[which(names(m1) =="Model")] ="Model_m1"names(m2)[which(names(m2) =="R2_percent")] ="R2_percent_m2"names(m2)[which(names(m2) =="Model")] ="Model_m2"# merge m1 and m2m1 = m1[,c("R2_percent_m1", "Phenotype", "Model_m1", "AtrophyScore", "comp")]m2 = m2[,c("R2_percent_m2", "Phenotype", "Model_m2", "AtrophyScore", "comp")]both =merge(m1, m2, by =c("comp", "Phenotype", "AtrophyScore"))# I decided to calculuate the residual score model in 3.1 as a nested model, hence needs manual renamingboth$AtrophyScore[grepl("TBVstand", both$Model_m1) &grepl("ICVstand", both$Model_m1)] ="Residual Score"#### figure out for each of the comparisons if the chi2 test was significantboth$sig =NAfor(i in both$comp){# get raw data raw =get(i)# find chi2p value chi2p = raw$LRT$`Pr(>Chi)`[2]# if it's packyears, check for different formattingif(any(grepl("chi2p", names(raw$LRT)))){chi2p = raw$LRT$chi2p}# store in 'both' both$sig[which(both$comp == i)] = chi2p}####################################################### unfortunately the data structures are different enough between the different Aims, that I will process each aim separately####################################################### Aim 3.1######################################################res = both[grep("3.1_", both$comp),]# remove CSF because its confusingres = res[which(res$AtrophyScore !="CSF"),]# x and y axis labelsmodelX ="[Phenotype ~ Atrophy Score] "modelY ="[Phenotype ~ TBV] "# filter phenotypes#sigTraits = c("iCog","sCog","iFrailty","sFrailty","iBMI","sBMI","BrainAge","dementia","hypertension")#res$Phenotype[!res$Phenotype %in%sigTraits] = NAplot3.1=plot_aim3.1(res = res, modelX = modelX,modelY = modelY,chi2sigThreshold =0.5/sum(!is.na(res$sig)))+ggtitle("Aim 3.1: Does an Atrophy Score explain more variance than TBV alone?")####################################################### Aim 3.2 (ICV)######################################################res = both[grep("3.2_", both$comp),]res = res[grep("ICV_", res$comp),]# x and y axis labelsmodelX = res$Model_m1[1]modelX = stringr::str_replace(modelX, pattern ="diff_stand", replacement ="AtrophyScore")modelX = stringr::str_remove(modelX, pattern ="stand")modelX =paste0("[", modelX, "] ")modelY= res$Model_m2[1]modelY = stringr::str_remove(modelY, pattern ="stand")modelY =paste0("[", modelY, "] ")# determine chi-squared p-value cut off (save for models with ICV and TBV)chi2sigThreshold =0.5/(13*3)ICV3.2=plot_aim3.2(res = res, modelX = modelX,modelY = modelY,chi2sigThreshold = chi2sigThreshold)# add titleICV3.2= ICV3.2+ggtitle("Aim 3.2: Does a cross-sectional atrophy score add explanatory\nvariance above and beyond ICV?")####### Aim 3.2 (TBV)######res = both[grep("3.2_", both$comp),]res = res[grep("TBV_", res$comp),]# x and y axis labelsmodelX = res$Model_m1[1]modelX = stringr::str_replace(modelX, pattern ="diff_stand", replacement ="AtrophyScore")modelX = stringr::str_remove(modelX, pattern ="stand")modelX =paste0("[", modelX, "] ")modelY= res$Model_m2[1]modelY = stringr::str_remove(modelY, pattern ="stand")modelY =paste0("[", modelY, "] ")TBV3.2=plot_aim3.2(res = res, modelX = modelX,modelY = modelY,chi2sigThreshold = chi2sigThreshold)# add titleTBV3.2= TBV3.2+ggtitle("Aim 3.2: Does a cross-sectional atrophy score add explanatory\nvariance above and beyond TBV?")# combine both plotsggpubr::ggarrange(ICV3.2, TBV3.2, common.legend = T, legend ="bottom")png("test.png", width =1200, height =700, bg ="white", res =800)# combine both plotsggpubr::ggarrange(ICV3.2, TBV3.2, common.legend = T, legend ="bottom")dev.off()############################# histogramggplot(data = res)+geom_histogram(aes(x = sig, fill = AtrophyScore))+xlab("Chi-squared p-values")+theme_bw()####################################################### Aim 3.3######################################################res = both[grep("3.3_", both$comp),]# x and y axis labelsmodelX ="[Phenotype ~ estimated Atrophy + observed Atrophy] "modelY ="[Phenotype ~ estimated Atrophy] "chi2sigThreshold =0.5/sum(!is.na(res$sig))plot_aim3.3(res = res, modelX = modelX,modelY = modelY,chi2sigThreshold = chi2sigThreshold)+ggtitle("Aim 3.3: Do estimated Atrophy Scores capture all trait relevant variance observed Atrophy Scores capture?")# width 800, height 700
LBC1936: Aim 3.1
LBC1936: Aim 3.2
LBC1936: Aim 3.3
UK Biobank
Aim 3.1
We hypothesise that evidence from Section 3.1 will confirm that health outcome prediction in older-age populations can be amplified when models consider ICV as a covariate alongside TBV, as this should focus the analysis on brain matter losses rather than differences in head size.
Difference score
Health-related phenotypes ~ ICV time 2 - TBV time 2
Health-related phenotypes ~ TBV time 2
Code
# read in UKB data neuro =fread(paste0(wd, "/UKB_neuroNoLongProcess.txt"), data.table = F)pheno =fread(paste0(wd, "/UKB_allPheno.txt"), data.table = F)# get wave of interestneuro = neuro[which(neuro$wave ==3),]# standardise numeric variables ColNames =c("cog", "BMI")pheno[,ColNames] =as.data.frame(lapply(pheno[,ColNames], scale))# iterate through all LBC traitsfor(i innames(pheno)[which(names(pheno) !="f.eid")]){# define models model1 =paste0(i, " ~ diff_stand") model2 =paste0(i, " ~ TBVstand") neuroWave =3if(i %in%c("cog","BMI")){ modelType ="Linear" }elseif(i %in%c("dementia", "APOEe4", "diabetes", "hypertension", "stroke")){ modelType ="Logistic" }elseif(i %in%c("packyears","frailty")){ modelType ="Hurdle" }# run Aim3 function res =Aim3(neuro = neuro, #neuroWave = neuroWave,pheno = pheno,model1 = model1,model2 = model2,modelType = modelType, Cohort ="UKB", Aim ="3.1")# name it according to its testassign(paste0("UKB_3.1_diff_", i), res)}ls(pattern ="UKB_3.1_diff")
Ratio score
Health-related phenotypes ~ TBV time 2 / ICV time 2
Health-related phenotypes ~ TBV time 2
Code
# iterate through all LBC traitsfor(i innames(pheno)[which(names(pheno) !="f.eid")]){# define models model1 =paste0(i, " ~ ratio_stand") model2 =paste0(i, " ~ TBVstand") neuroWave =3if(i %in%c("cog","BMI")){ modelType ="Linear" }elseif(i %in%c("dementia", "APOEe4", "diabetes", "hypertension", "stroke")){ modelType ="Logistic" }elseif(i %in%c("packyears","frailty")){ modelType ="Hurdle" }# run Aim3 function res =Aim3(neuro = neuro, #neuroWave = neuroWave,pheno = pheno,model1 = model1,model2 = model2,modelType = modelType, Cohort ="UKB", Aim ="3.1")# name it according to its testassign(paste0("UKB_3.1_ratio_", i), res)}ls(pattern ="UKB_3.1_ratio")
Residual score
Health-related phenotypes ~ TBV time 2 + ICV time 2
Health-related phenotypes ~ TBV time 2
Code
# iterate through all LBC traitsfor(i innames(pheno)[which(names(pheno) !="f.eid")]){# define models model1 =paste0(i, " ~ TBVstand + ICVstand") model2 =paste0(i, " ~ TBVstand") neuroWave =3if(i %in%c("cog","BMI")){ modelType ="Linear" }elseif(i %in%c("dementia", "APOEe4", "diabetes", "hypertension", "stroke")){ modelType ="Logistic" }elseif(i %in%c("packyears","frailty")){ modelType ="Hurdle" }# run Aim3 function res =Aim3(neuro = neuro, #neuroWave = neuroWave,pheno = pheno,model1 = model1,model2 = model2,modelType = modelType, Cohort ="UKB", Aim ="3.1")# name it according to its testassign(paste0("UKB_3.1_resid_", i), res)}ls(pattern ="UKB_3.1_resid")
CSF
Health-related phenotypes ~ CSF time 2 + ICV time 2
Health-related phenotypes ~ CSF time 2
Code
# iterate through all LBC traitsfor(i innames(pheno)[which(names(pheno) !="f.eid")]){# define models model1 =paste0(i, " ~ CSFstand + ICVstand") model2 =paste0(i, " ~ CSFstand") neuroWave =3if(i %in%c("cog","BMI")){ modelType ="Linear" }elseif(i %in%c("dementia", "APOEe4", "diabetes", "hypertension", "stroke")){ modelType ="Logistic" }elseif(i %in%c("packyears","frailty")){ modelType ="Hurdle" }# run Aim3 function res =Aim3(neuro = neuro, #neuroWave = neuroWave,pheno = pheno,model1 = model1,model2 = model2,modelType = modelType, Cohort ="UKB", Aim ="3.1")# name it according to its testassign(paste0("UKB_3.1_CSF_", i), res)}ls(pattern ="UKB_3.1_CSF")
Aim 3.2
Health-related phenotypes ~ ICV time 2 (or TBV time 2) + cross-sectional atrophy time 2
Health-related phenotypes ~ ICV time 2 (or TBV time 2)
Note: repeat this analysis twice for models with TBV and models with TCV and for each cross-sectional atrophy measure (diff, resid, ratio)
Difference score
Code
##### Model 1: comparison against ICV# iterate through all LBC traitsfor(i innames(pheno)[which(names(pheno) !="f.eid")]){# define models model1 =paste0(i, " ~ ICVstand + diff_stand") model2 =paste0(i, " ~ ICVstand") neuroWave =3if(i %in%c("cog","BMI")){ modelType ="Linear" }elseif(i %in%c("dementia", "APOEe4", "diabetes", "hypertension", "stroke")){ modelType ="Logistic" }elseif(i %in%c("packyears","frailty")){ modelType ="Hurdle" }# run Aim3 function res =Aim3(neuro = neuro, #neuroWave = neuroWave,pheno = pheno,model1 = model1,model2 = model2,modelType = modelType, Cohort ="UKB", Aim ="3.2")# name it according to its testassign(paste0("UKB_3.2_diffvsICV_", i), res)}##### Model 2: comparison against TBV# iterate through all LBC traitsfor(i innames(pheno)[which(names(pheno) !="f.eid")]){# define models model1 =paste0(i, " ~ TBVstand + diff_stand") model2 =paste0(i, " ~ TBVstand") neuroWave =3if(i %in%c("cog","BMI")){ modelType ="Linear" }elseif(i %in%c("dementia", "APOEe4", "diabetes", "hypertension", "stroke")){ modelType ="Logistic" }elseif(i %in%c("packyears","frailty")){ modelType ="Hurdle" }# run Aim3 function res =Aim3(neuro = neuro, #neuroWave = neuroWave,pheno = pheno,model1 = model1,model2 = model2,modelType = modelType, Cohort ="UKB", Aim ="3.2")# name it according to its testassign(paste0("UKB_3.2_diffvsTBV_", i), res)}ls(pattern="UKB_3.2_diff")
Ratio score
Code
##### Model 1: comparison against ICV# iterate through all LBC traitsfor(i innames(pheno)[which(names(pheno) !="f.eid")]){# define models model1 =paste0(i, " ~ ICVstand + ratio_stand") model2 =paste0(i, " ~ ICVstand") neuroWave =3if(i %in%c("cog","BMI")){ modelType ="Linear" }elseif(i %in%c("dementia", "APOEe4", "diabetes", "hypertension", "stroke")){ modelType ="Logistic" }elseif(i %in%c("packyears","frailty")){ modelType ="Hurdle" }# run Aim3 function res =Aim3(neuro = neuro, #neuroWave = neuroWave,pheno = pheno,model1 = model1,model2 = model2,modelType = modelType, Cohort ="UKB", Aim ="3.2")# name it according to its testassign(paste0("UKB_3.2_ratiovsICV_", i), res)}##### Model 2: comparison against TBV# iterate through all LBC traitsfor(i innames(pheno)[which(names(pheno) !="f.eid")]){# define models model1 =paste0(i, " ~ TBVstand + ratio_stand") model2 =paste0(i, " ~ TBVstand") neuroWave =3if(i %in%c("cog","BMI")){ modelType ="Linear" }elseif(i %in%c("dementia", "APOEe4", "diabetes", "hypertension", "stroke")){ modelType ="Logistic" }elseif(i %in%c("packyears","frailty")){ modelType ="Hurdle" }# run Aim3 function res =Aim3(neuro = neuro, #neuroWave = neuroWave,pheno = pheno,model1 = model1,model2 = model2,modelType = modelType, Cohort ="UKB", Aim ="3.2")# name it according to its testassign(paste0("UKB_3.2_ratiovsTBV_", i), res)}ls(pattern="UKB_3.2_ratio")
Residual score
Code
##### Model 1: comparison against ICV# iterate through all LBC traitsfor(i innames(pheno)[which(names(pheno) !="f.eid")]){# define models model1 =paste0(i, " ~ ICVstand + resid_stand") model2 =paste0(i, " ~ ICVstand") neuroWave =3if(i %in%c("cog","BMI")){ modelType ="Linear" }elseif(i %in%c("dementia", "APOEe4", "diabetes", "hypertension", "stroke")){ modelType ="Logistic" }elseif(i %in%c("packyears","frailty")){ modelType ="Hurdle" }# run Aim3 function res =Aim3(neuro = neuro, #neuroWave = neuroWave,pheno = pheno,model1 = model1,model2 = model2,modelType = modelType, Cohort ="UKB", Aim ="3.2")# name it according to its testassign(paste0("UKB_3.2_residvsICV_", i), res)}##### Model 2: comparison against TBV# iterate through all LBC traitsfor(i innames(pheno)[which(names(pheno) !="f.eid")]){# define models model1 =paste0(i, " ~ TBVstand + resid_stand") model2 =paste0(i, " ~ TBVstand") neuroWave =3if(i %in%c("cog","BMI")){ modelType ="Linear" }elseif(i %in%c("dementia", "APOEe4", "diabetes", "hypertension", "stroke")){ modelType ="Logistic" }elseif(i %in%c("packyears","frailty")){ modelType ="Hurdle" }# run Aim3 function res =Aim3(neuro = neuro, #neuroWave = neuroWave,pheno = pheno,model1 = model1,model2 = model2,modelType = modelType, Cohort ="UKB", Aim ="3.2")# name it according to its testassign(paste0("UKB_3.2_residvsTBV_", i), res)}ls(pattern="UKB_3.2_resid")
Aim 3.3
Health-related phenotypes ~ cross-sectional atrophy time 2 + longitudinal atrophy
Health-related phenotypes ~ cross-sectional atrophy time 2
Difference score
Code
# read in longitudinal processed data neuro =fread(paste0(wd, "/UKB_neuroNoLongProcess.txt"))# keep only second waveneuro = neuro[which(neuro$wave ==3),]# iterate through all LBC traitsfor(i innames(pheno)[which(names(pheno) !="f.eid")]){# define models model1 =paste0(i, " ~ diff_stand + TBVdiff_2to3_stand") model2 =paste0(i, " ~ diff_stand") neuroWave =3if(i %in%c("cog","BMI")){ modelType ="Linear" }elseif(i %in%c("dementia", "APOEe4", "diabetes", "hypertension", "stroke")){ modelType ="Logistic" }elseif(i %in%c("packyears","frailty")){ modelType ="Hurdle" }# run Aim3 function res =Aim3(neuro = neuro, #neuroWave = neuroWave,pheno = pheno,model1 = model1,model2 = model2,modelType = modelType, na.action ="na.rm",Cohort ="UKB", Aim ="3.3")# name it according to its testassign(paste0("UKB_3.3_diff_", i), res)}ls(pattern="UKB_3.3_diff")
Ratio score
Code
# iterate through all LBC traitsfor(i innames(pheno)[which(names(pheno) !="f.eid")]){# define models model1 =paste0(i, " ~ ratio_stand + TBVratio_3to2_stand") model2 =paste0(i, " ~ ratio_stand") neuroWave =3if(i %in%c("cog","BMI")){ modelType ="Linear" }elseif(i %in%c("dementia", "APOEe4", "diabetes", "hypertension", "stroke")){ modelType ="Logistic" }elseif(i %in%c("packyears","frailty")){ modelType ="Hurdle" }# run Aim3 function res =Aim3(neuro = neuro, #neuroWave = neuroWave,pheno = pheno,model1 = model1,model2 = model2,modelType = modelType, na.action ="na.rm",Cohort ="UKB", Aim ="3.3")# name it according to its testassign(paste0("UKB_3.3_ratio_", i), res)}ls(pattern="UKB_3.3_ratio")
Residual score
Code
# iterate through all LBC traitsfor(i innames(pheno)[which(names(pheno) !="f.eid")]){# define models model1 =paste0(i, " ~ resid_stand + TBVresid_2to3_stand") model2 =paste0(i, " ~ resid_stand") neuroWave =3if(i %in%c("cog","BMI")){ modelType ="Linear" }elseif(i %in%c("dementia", "APOEe4", "diabetes", "hypertension", "stroke")){ modelType ="Logistic" }elseif(i %in%c("packyears","frailty")){ modelType ="Hurdle" }# run Aim3 function res =Aim3(neuro = neuro, #neuroWave = neuroWave,pheno = pheno,model1 = model1,model2 = model2,modelType = modelType, na.action ="na.rm",Cohort ="UKB", Aim ="3.3")# name it according to its testassign(paste0("UKB_3.3_resid_", i), res)}ls(pattern="UKB_3.3_resid")# save all models save(list=ls(pattern="UKB_"), file =paste0(wd, "/UKB_Aim3.4.RData"))
Plots generated with same code as printed for LBC above.